It’s Monday morning. You take a sip of your first coffee and open Looker Studio as the weekly marketing performance meeting begins. Everyone is eagerly waiting for the numbers. You click on the dashboard. Nothing. Suddenly, an error flashes: “Quota exceeded.” Sounds familiar, right?
Your dashboards are broken. The GA4 connection has already hit its token limit. Instead of clean insights, you’re left empty-handed. You open Google Analytics, then your CRM, then the email tool. By the time something resembling a KPI is on the screen, the meeting is almost over and the data is already outdated.
This isn’t just a bad Monday, but the reality for many marketing teams. As data volumes explode, native connectors and manual reporting can’t keep pace. To break the cycle, you need a marketing data pipeline, which is a reliable warehouse that ensures your dashboards never let you down when it matters most.
The problem with fragmented data
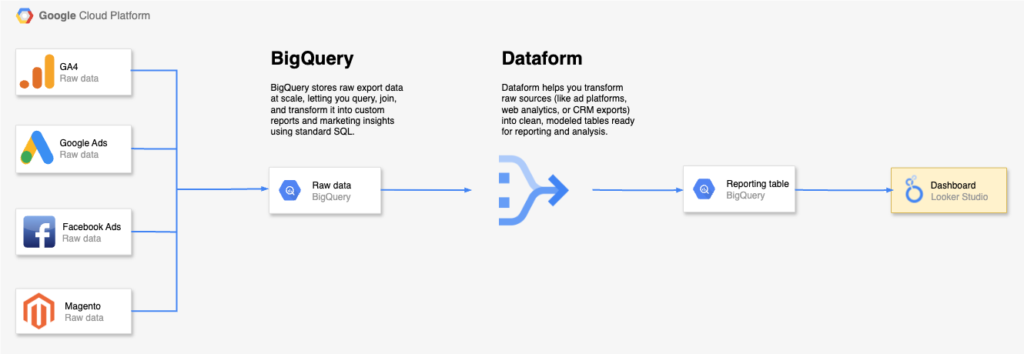
A typical GA4 modelling setup in BigQuery often looks like this:
GA4, Google Ads, CRMs, Meta, and marketing automation tools all speak different “languages.” Campaign structures may vary, time zones don’t align, and attribution models rarely match. Meta is a classic example. Its reporting often attributes far more conversions than GA4 does, because Meta credits almost every action it can link back to an ad. Additionally, GA4 often labels Paid Search under the generic campaign name “(organic)”. By using the Google Ads Data Transfer in BigQuery, you can recover the original campaign names through the GCLID (Google Click Identifier), ensuring your reporting reflects the actual campaigns.
As you can see, without a structured pipeline, you’re left spending more time reconciling these conflicting numbers than actually acting on insights.
What a marketing data pipeline does
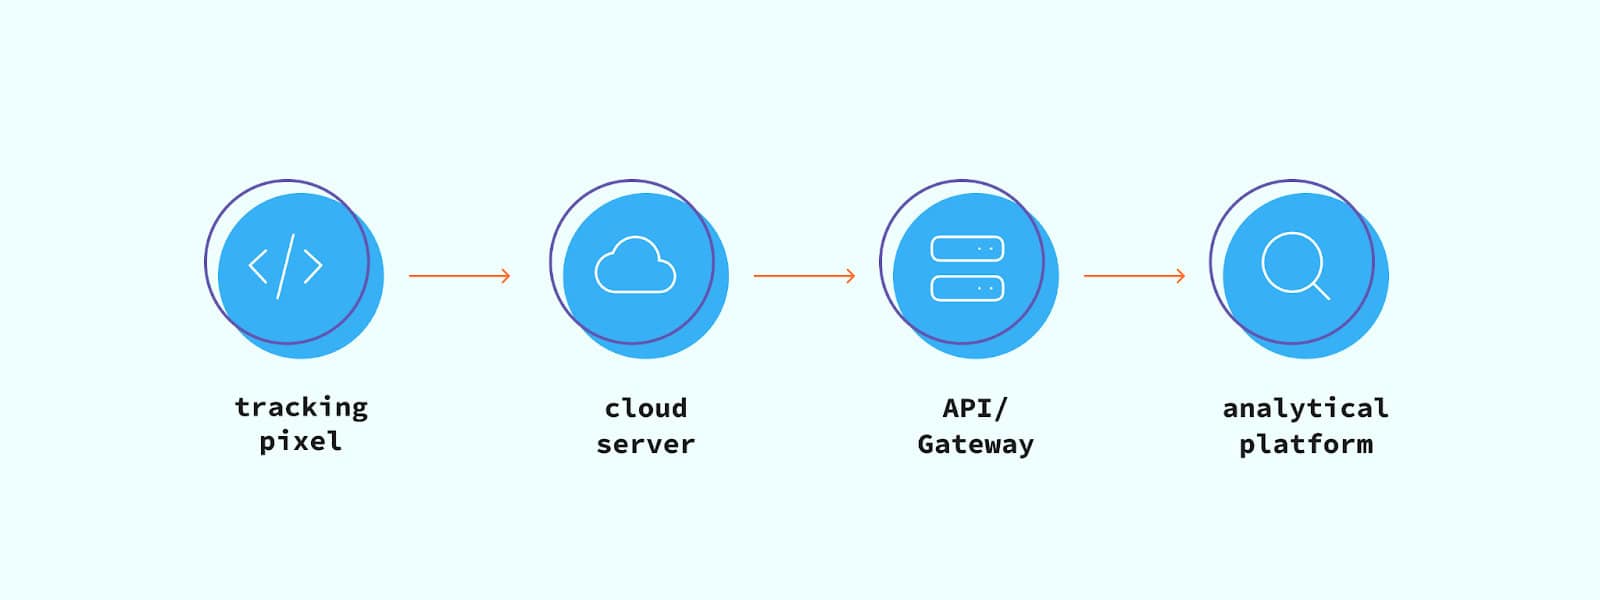
In a nutshell, a marketing data pipeline is the backbone of your reporting. It automatically:
- Extracts data from platforms (GA4, Google Ads, CRM, Meta, email, etc.).
- Transforms it into a clean, standardized format (aligning attribution, currencies, etc.).
- Loads it into a dashboard, such as Looker Studio or Power BI.
Why invest in a marketing data pipeline? The advantages of a data pipeline are manifold:
- Always-on dashboards – No broken reports or API limits; data flows automatically.
- Single source of truth – CRM revenue, ad spend, and web analytics all live together.
- Near real-time decisions – Campaign changes can be measured within minutes, not hours.
- Scalability – Adding new channels (LinkedIn Ads, TikTok, HubSpot) becomes relatively easy.
- Accuracy – Automated rules prevent human errors and keep numbers consistent.
Build a marketing data pipeline step by step
We have to admit: building a pipeline can feel overwhelming at first. But if you break it down into steps, it becomes much more manageable. Here’s a practical approach:
1. Choose a destination
Start with a data warehouse. This will be your central hub where all data converges. We often recommend BigQuery, thanks to its out-of-the-box connectors with GA4, Google Ads, Facebook Ads, DV360, etc.
2. Select connectors
Next, bring in data from your wider stack. Depending on your sources, use ETL tools such as Funnel.io or Airbyte to pull data from platforms like HubSpot, LinkedIn, Magento, and more.
3. Standardise & transform
This is where the real value emerges. Apply consistent naming conventions, align time zones and dates, convert currencies, and remove duplicates. These transformations ensure data from different platforms is directly comparable. Also, in most cases, you should diagram your sources and specify the join keys that link the datasets. If you’re working in BigQuery, Dataform is an excellent option for managing these transformations at scale.
4. Automate scheduling
Set up automated syncs so data updates daily—or even hourly—without manual exports. With Dataform in BigQuery, you can implement incremental loads, updating only new or changed records instead of reloading full datasets, saving both time and costs!
5. Visualize & monitor
Finally, connect your BI tool (e.g., Looker Studio, Power BI, Tableau) to the warehouse. Build dashboards that surface the metrics your team needs, and add monitoring to catch issues early. With Dataform assertions in BigQuery, you can even set rules that flag anomalies before they hit your reports.
Final thoughts
In 2026, the stakes are higher than ever. Privacy rules and complex customer journeys make it critical to own and control your data. A marketing data pipeline gives you reliability, speed, and insights. While reporting tools promise “plug-and-play” integrations, they usually stop at the basics. They can pull in data, but they rarely solve deeper issues like aligning attribution windows or blending revenue from your CRM with ad spend. That’s where a custom data pipeline makes the difference. By designing the flow yourself (or with a partner like us), you control the logic, ensure consistent business rules, and adapt the pipeline as your stack evolves.