How server-side tracking enhances data accuracy in GA4
Have you ever noticed that the number of conversions displayed in your reports is smaller than the actual amount shown in the CRM? If yes, you should have already gone...
Beyond Accuracy: How to Evaluate Unsupervised Models for Reliable Data Insights
Unsupervised learning is a form of machine learning that identifies patterns and structures in data without relying on labelled examples or predefined outcomes. That is both its greatest strength and its biggest...
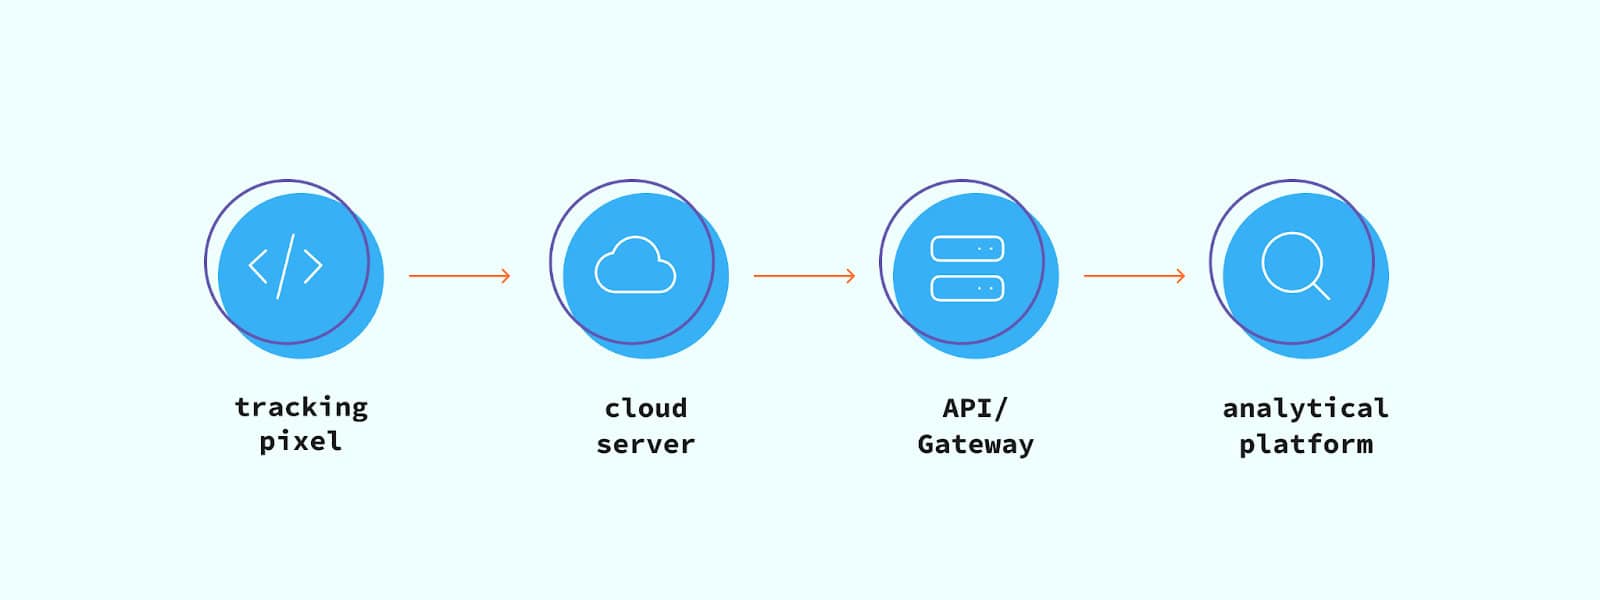
GA4 Measurement Protocol: Sending Server-Side Events with Webhooks
Have you ever wondered how to see refunds in GA4 or how to add (dis)qualified leads to GA4? This is where the GA4 Measurement Protocol really shines. The GA4 Measurement...
It’s Monday morning. You take a sip of your first coffee and open Looker Studio as the weekly marketing performance meeting begins. Everyone is eagerly waiting for the numbers. You...
A scalable way to handle multiple GA4-properties in Dataform
Many organisations don’t just have one GA4 property – they have several. A webshop might split brands, countries and domains across different properties, and before you know it you’re maintaining...
Staying on Track with Dataform Railway Design - Streamlining Dataform Development with Local Setup and CI/CD
Explore how to streamline Dataform local development using CI/CD integration. Automate schema testing, manage environments, optimize workflows, and build scalable, reliable data pipelines.