Recent research by Salesforce shows that a lot of companies still have issues getting value out of their data. In our opinion a big part of a (partial) solution to this is the use of proper processes and approaches. We are certainly not the only one’s focussing more on process instead of technology. Most points in this blog have been made by other people in various posts on Linkedin, blogs, video’s, etc. So basically this blog is not going to tell you anything new, but will give an overview of the main steps to take to reduce the barriers to data value.
The barriers
According to Salesforce’s Untapped Data Research, business leaders all over the world are struggling to put data into practice and make sense of it. This makes it difficult to make strategic business decisions. Below you can see the results of surveying 9,837 business leaders globally, and what the three most common barriers are to unlocking data value.

When looking at barriers like these we, in the industry, have a tendency to look for new tools to solve these issues. We start to implement data catalogues, metric stores, new visualisation tools, etc. as these show immediate tangible results (and we like new shiny technology). Also when talking to their peers, data analysts (including us from time to time) usually ask questions such as “which tools did you use?”.
The focus should be more on the process and less on the tool! In the end data should give insights and thereby add value. So let’s look at the process of data analysis.
The data analysis process
Let’s bring it back to the (boring) basics: below is a diagram of the data analysis process. Starting off with identification of the problem, or in other words: what is the (real) questions to answer. When that is clear you can start collecting relevant data for it. Then, cleaning up the data in preparation for analysis and finally, either interpreting or acting on that analysis. In our case, often by making strategic decisions based on analysis and therefore acting on it.

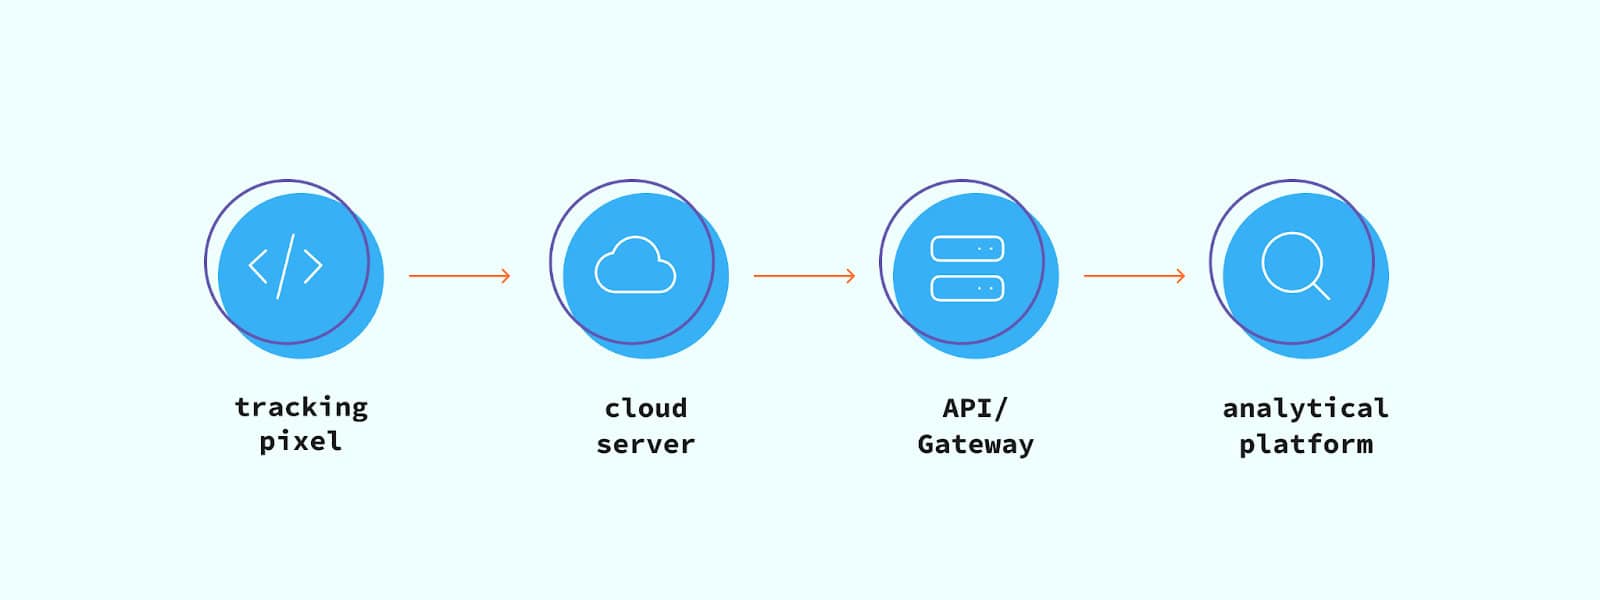
With this process we can have a look at the main barriers identified in the Salesforce research. We will start with the barrier of ‘too much data’ which is mainly created in the identification and collection phase.
Identify & Collect – more data = more problems
A couple of years ago the main priority was to collect as much data as possible. There seemed to be a fear of missing out on data. What would happen if we did not track the click on the logo of the website. At the same time the general assumption was more data is more value.
A fitting analogy is the underpants gnomes from South Park, where they steal underpants from children and their business plan remains a mystery:
- Phase 1: collecting underpants
- Phase 2: …?
- Phase 3: Profit!!!

This not only applies to web/app tracking. Companies make it their priority to get as much information as they can about a customer. To illustrate, take the example of the so-called customer 360 view you have likely come across, whereby companies want to know every little detail of their customer.
With companies that want to know everything about someone, from all their Facebook activity to when they sneeze, it is no surprise that ‘too much data’ has become a barrier in unlocking data value. Rather, data analysts should be critical and ask the right questions to ensure only relevant data is collected. ‘More data = more problems’ is quite a logical equation: more data means that more storage, maintenance and time are required.
What questions to ask?
The simple solution is to be critical about which data should be collected. This can be done by just asking a couple of questions. To not take credit for other people’s work, below are some examples from Rick Dronkers of what critical questions to ask. These questions work for dashboarding, but are also definitely effective when discussing what data to collect. For example, asking further questions about what actions people plan to take once they have access to a datapoint. This can help them reconsider whether the data point is actually necessary or if they got caught up in trying to collect as much data as possible.

Clean – more queries = more problems
Moving onto data cleaning, limiting and keeping an overview remains important. When a specific question for data is asked, it often happens that a new query is written for it and scheduled separately. If this repeats itself over a few weeks, it is not uncommon to lose an overview and end up with incorrect data, without understanding why. This increases the barrier of having a ‘lack of understanding of data’.
A second problem is the gap between business and data analysts. The following situation probably sounds familiar: a data analyst hands a table or dashboard to someone from business who does not understand it because they use different terms. One of them calls something an ‘item category’, the other calls it an ‘item type’.
The solution for both problems is not a tool like dataform or DBT. In the cleaning phase, the process is more important than the tool you pick. The solution is to talk to the business to fully understand it and then model the business. After that you can map your data to this model. Again other people have written great posts about it, for example see: https://tasman.ai/blog/domain-modeling/.

Analyse – less able people = more problems

With an abundance of data, growing in size by the day, it is clear that there will never be enough data analysts. Less people who are able to analyse data means more problems, as it creates a ‘lack of ability to generate insights from data’, one of Salesforce’s barriers.
To solve this, we need to carefully document data, thereby enabling more people to understand and analyse data. The problem with documentation does not always lie in IF documentation is written, rather in HOW it is written. The diagram below shows four different documentation types. Data analysts often write mere references, which are more theoretical and written for technical people. Instead, a tutorial or how-to-guide with screenshots and the way events work in GA4, for example, would enable less technical people to better understand data. By taking into account the target audience of documentation, more people will be able to generate insights from data.

The solution to the barriers: MDMA
So going back to the original barriers there are 3 simple processes / steps you can do to make applying insights easier:
- Minimise measurements
- Document it for the different users
- Model the data
- Apply the insights
Minimising measurement helps you avoid the barrier of too much data and can keep an overview to maintain the ability to generate insights. By documenting for different users, you enable more people to understand data and generate insights from it. By modelling the data, you bridge the gap between data and business, once again improving understanding and the ability to generate insights. Applying insights is the holy grail, it is what all the previous steps are for, and otherwise the acronym does not hold.
In reminiscence of Amsterdam Dance Event, it is no surprise that MDMA is the solution to avoid Salesforce’s barriers. Wikipedia backs up this claim, as some of the effects of MDMA can be seen below:

As data analysts/engineers/scientists we can all use some euphoria, increased self-confidence, relaxation and reduced anxiety. So to me it seems that we all should be applying MDMA.
Feel like reading more data stories? Then take a look at our blog page. Always want to stay up to date? Be sure to follow us on LinkedIn!