Why do we need one reporting tool, and not a single source of truth? So, we can create the hybrid reporting setup.
Over the last few months, we received a lot of questions about what the right and best reporting tool is? Would a switch to a different tool might be better perhaps? The answer is always the same, which is that it depends on your setup. Therefore, we prefer the question: “Do you actually need a single reporting tool?
Why a hybrid setup?
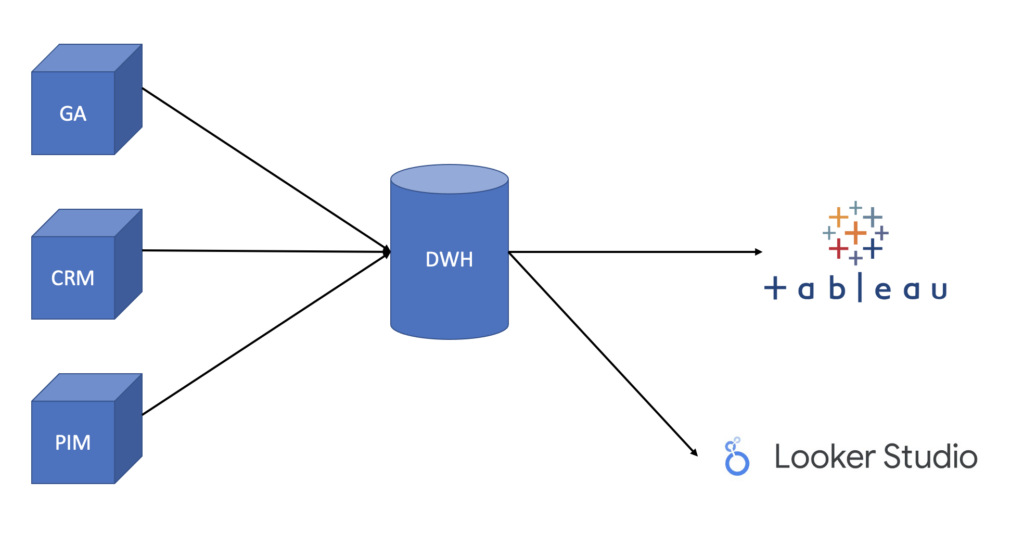
The reason is simple. If you want to use one tool, then you must use that tool for every user. But this means that you need the technical setup, such as a cloud or online license for everyone as well. If you have a solid data warehouse with well-connected systems sending their data to it, you can rely on your single source of truth, which is the data warehouse. It also allows you to use the reporting tool that best suits the needs of a specific department or group.
The basics
A reporting tool is exactly what it says it is, a reporting tool. However, more and more often they are also used for some sort of ETL process or even connecting complete sources as well. We get it, it’s very tempting to use the friendly connectors of Tableau or PowerBI. However, that means that the logic, processes and formulas also live in the reporting tool. For example, if you write a perfect piece of code in DAX for PowerBI you will have to leave it there forever. Because it either must be rewritten for a SQL-based data warehouse nor it can’t be used in another non-DAX (which is basically every other tool) either.
As a fundamental, to do proper reporting on data, you simple need a data warehouse. Within that data warehouse you have a lot of ETL-processes and codes running that should create at least the following two marts:
- mart_Reporting
- mart_Analytics
Within the reporting mart, you can create all the aggregated and combined tables that you would need for reporting. Ideally, they are always created and checked by the analysts and then published for use in all domains. Within the analytics mart the cleaned tables for all the sources are stored. In that way you can either use the reporting mart for direct reporting or the analytics mart for combined and more calculated reporting views. By doing this, the core logic and procedures are stored centrally and available for every system or tool that connects to the data warehouse. Not only reporting tools, but also marketing systems etc.
Want to use a new tool? Just connect to the same source and they will tell you the exact same story as the other tool did. Have a calculated field that attaches the CLV to a customer? Make it a part of the query’s running daily and have that field available in your customer table, so it can be used in every reporting tool but also all other systems that you want to connect.
So why hybrid then?
Hybrid in terms of hybrid cars means that you’re using the best of both worlds. Electricity when it is available, and usually for the short distances, and some form of fossil fuel for the longer distances when electricity is already used for city traffic. Do the same with your reporting tool. Usually for the reporting tool there are two needs. First there is the need of making big, complicated and very interactive reports. It’s free to use and most often understandable for most people within the organization. Therefore, they can make minor changes or simple new reports that they would otherwise need your time for.
Conclusion on the Hybrid reporting model
If both tools work on the same single source of truth, which is the data warehouse, then the numbers and logic you’re working with is the same everywhere. With this setup you don’t need a whole online environment or a pile of licenses to have the whole organization onboard the more sophisticated reporting tool. You only use that tool for the bigger and more complicated reports.
For all the basic reports you would something like Looker Studio. Since Looker Studio is free to use and has basic scheduling, charting and a lot of data sources to connect it can act as a perfect hybrid part with a tool as Tableau or PowerBI. However, the costs and needed skill level are way less.
The hybrid setup will not only decrease your costs and needed time, but it also forces you to focus on your basics which serves you in so many other fields than reporting as well.
Follow The Data Story on LinkedIn to stay up to date on our blogs and more!