Now that we have decided to switch from Dataform to DBT, how do we get started? Starting to use a new tool always comes with some hurdles. We definitely came across them and had some painful stumbles. To help get started and avoid some of these hurdles, this guide will take you by the hand for your first steps onto the Dataform path. If you already have some experience with Dataform, take a good look at the four section headers to find what you want to learn more about!
First this guide will go over the basics of Git, the backbone of version control in Dataform. Next, this guide will give an example file structure to cling onto when working on your first Dataform project. Thereafter, this guide will explain how to incorporate Javascript into SQL. Lastly, the way to reuse variables and methods will be discussed, along with how to apply this to create ‘templates’ for your workflows that can be deployed across different projects.
1. Basics of version control with Git
Dataform uses Git for its version control system. Although familiar to many, there are definitely people who can use a short explanation to understand the basics. For developers, version control is a foundational utility as it allows to go back and forth between different versions of code. This way, when developers add new features that cause errors, they can easily switch back to working versions of their code.
It can be considered a more advanced variant of the ‘undo’ action when writing documents. The way it works is as follows: all versions are saved on a branch. When a developer wants to add a new feature, he pushes his update to the branch. When a developer wants to get the latest version, he pulls from the branch.
Developers can also create a new branch which is a copy of another branch. Making changes to this copy, this new branch, does not change anything on the original branch, meaning new features can be developed without interfering with the working product. To add a finished feature to the working product, that branch is merged back into the original branch. Dataform creates a new branch for each development workspace that is created. Version control actions can be performed on the top-left of Dataform’s editor.
2. File structure for your Dataform project
As you might have learned over the years, an organised working environment helps you work more efficiently. Working in Dataform is not any different, organising your project goes a long way. It is good practice to use a file structure, such as the one below that we use:
- /definitions: contains SQLX files for views and tables
- sources: declaration of data sources
- directory for all stages: definition of base, mart, reporting tables
- tests: assertions
- /includes: Javascript constants and functions, to be reused in the rest of your repository
- constants.js
- functions.js
- dataform.json: default settings file

3. How to use Javascript in Dataform
The ability to use Javascript in Dataform or Jinja in DBT is what makes these data transformation tools so versatile and useful. Javascript can be incorporated into SQL code in an SQLX file by placing it between curly braces preceded by a dollar sign like so: ${Javascript code here}. This way, Javascript variables and methods defined in different files can be referenced and reused. When your code contains an operation or piece of SQL code that is used over and over again, writing a Javascript method for it can be a wise choice.
Be careful when using Javascript inside of strings, so-called templating: use backticks instead of apostrophes! This tip would have saved me an embarrassing amount of time. Let’s not turn the knife into the wound and quickly move on!
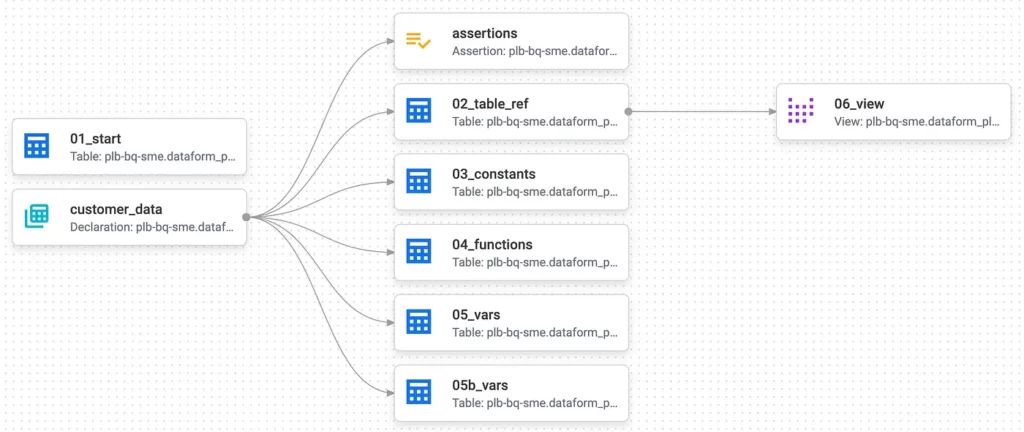
Developers can use the ref() function to reference another SQL view or table and declare it as a dependency for the view or table that contains the ref() function. Dataform uses this to execute actions in the right order when running a workflow, as well as for constructing a dependency graph that gives developers a handy overview of dependencies in a project.
An example is shown below. More information about the ref() function can be found in the Dataform Docs. Another use for Javascript in Dataform is to define how operations should differ when an incremental table is run incrementally or non-incrementally. Incremental tables are a way to append new data to a table without looking through all the old data that is already there, making it a more efficient way of, for instance, saving snapshots. To do so, use the when() function as follows: ${when(incremental(), THEN, OPTIONAL ELSE)}. This enables developers to, for example, define a date range that Dataform should query when an action is run incrementally.

4. Reusing Javascript variables and methods in Dataform
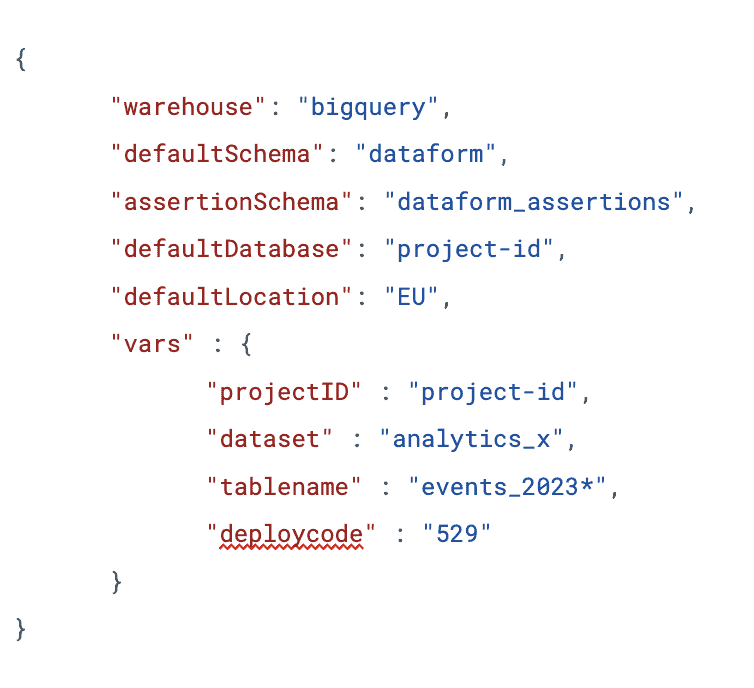
Reusing Javascript variables and methods is one of the most, if not the most, important feature for us in Dataform. It means code can easily be reused across different datasets and projects, making the setup of similar projects much easier. Javascript variables and methods can be defined in files and exported to the rest of the project by putting them inside a module.exports object inside that file like so: module.exports = { variablename, methodname}. To change variable values across different deployments, use the dataform.json file. The dataform.json file can be used to change a project’s default settings as well as to define project variables. These project variables can be changed per deployment, so let’s consider them ‘template variables’. To define them, add a vars object to dataform.json and add variables in the same way as below:

Once these variables have been added, they can be referenced in other files like so: ${dataform.projectConfig.vars.deploycode}. When you create a new release configuration, which is how you deploy and schedule a Dataform project, you can set compilation variables and override the values in vars. After following these steps, you have created a ‘template’ that can be deployed to different projects by pressing only a few buttons, super handy

After reading these four sections of tips and tricks, you should have a lot more fun and confidence using Dataform! If you still happen to stumble over another hurdle and fall down, take another good look at the Dataform Docs. A more inspiring alternative when falling down is to think of what Rocky said and “keep moving forward”! We are also more than happy to help you move forward!

Feel like reading more data stories? Then take a look at our blog page. Always want to stay up to date? Be sure to follow us on LinkedIn!


