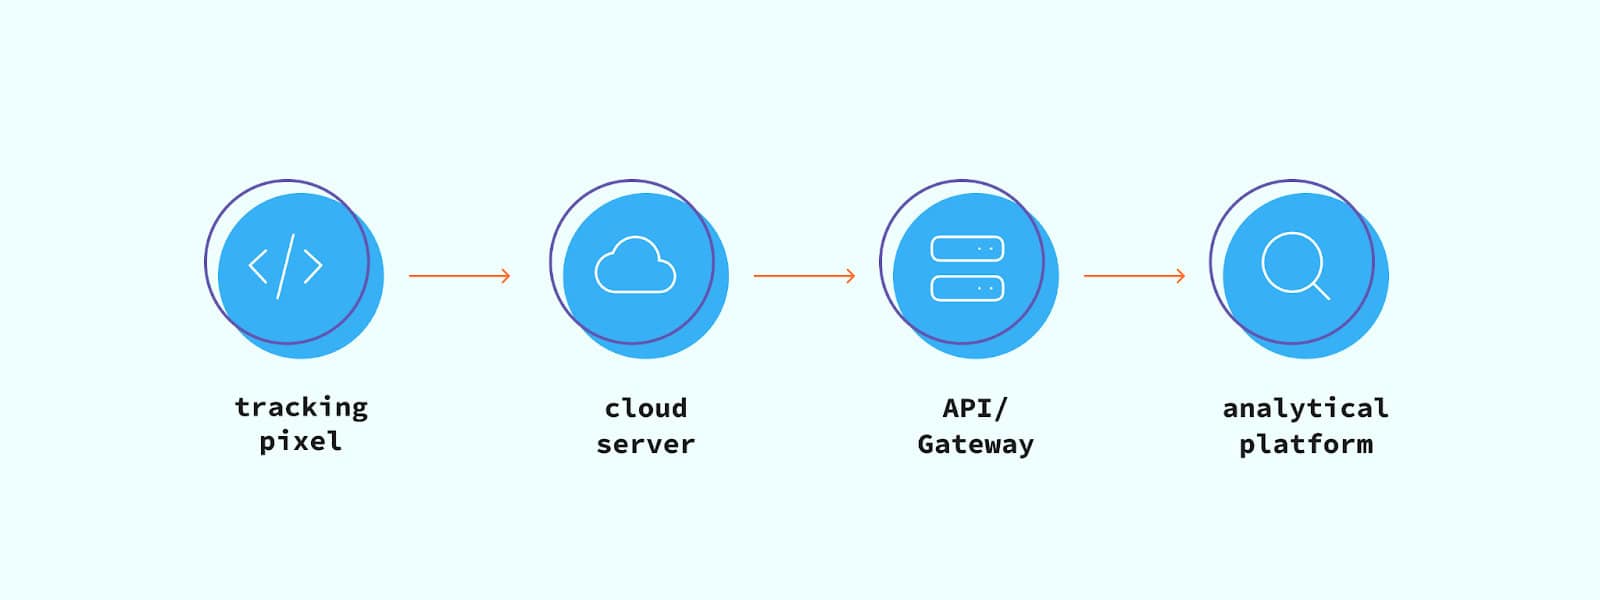
At The Data Story we try to make data understandable. To us, that is one of the most important aspects of turning data into gold. Once you understand what the data is telling you, you can turn that insight into value. For this, it is essential to go beyond where the data comes from and understand what it actually represents. Digital behavioural data is generated by the things people do online. In this blog we will look at why time-on-site doesn’t give you the right insights.
Time/Events on site
As the name suggests, time-on-site indicates how much time someone spent on a website. However, how important is it really and what does it tell us? Can it put us on the wrong foot due to things out of our control? For example, your audience might:
- Be slow readers
- Have difficulty understanding your content
- Have multiple tabs open that all gather “minutes-on-the-web”, which add up crazily rapid, while they compare your content with others
So while you might consider high time-on-site as something positive, it’s possible you are mistaken. Your audience could either be struggling or could be doing something very different that takes time but doesn’t provide you any value. What to focus on instead? Well, since you want to measure engagement and interactions, you should focus on a data point that more clearly represents this. As an example, we suggest you take a look at events.

Which events to focus on?
Not all events are created equal. As explained before, when connecting data to behaviour you should check whether the data correctly represents that behaviour. For instance, clicks, pageviews and interactions all indicate dedication and interest for a product or service on the site. However, if a page is not well-constructed, scrolling is likely not data you want to consider when studying such behaviour. The same goes for a timer that sends an event every minute, as it is time-based data similar to the time-on-site discussed previously.
So, be careful what data you use to study the right data points to measure success.
Follow The Data Story on LinkedIn to stay up to date on our blogs and more!